30 releases
Uses new Rust 2024
| new 0.4.19 | Jun 3, 2026 |
|---|---|
| 0.4.13 | Apr 27, 2026 |
| 0.3.0 | Mar 31, 2026 |
#77 in #charts
58 downloads per month
Used in 3 crates
3.5MB
76K
SLoC
ruviz
High-performance 2D plotting library for Rust.

![]()
![]()
Quick Start
Add the crate:
[dependencies]
ruviz = "0.4.19"
Create and save a PNG:
use ruviz::prelude::*;

fn main() -> Result<()> {
    let x: Vec<f64> = (0..100).map(|i| i as f64 * 0.1).collect();
    let y: Vec<f64> = x.iter().map(|&v| v.sin()).collect();

    Plot::new()
        .line(&x, &y)
        .title("Sine Wave")
        .xlabel("x")
        .ylabel("sin(x)")
        .save("sine.png")?;

    Ok(())
}
Run with:
cargo run --release
Common API
The main API is the fluent Plot builder. Series are finalized automatically when
you render, save, or start another series.
use ruviz::prelude::*;
fn main() -> Result<()> {
let x = vec![0.0, 1.0, 2.0, 3.0, 4.0];
let linear = x.clone();
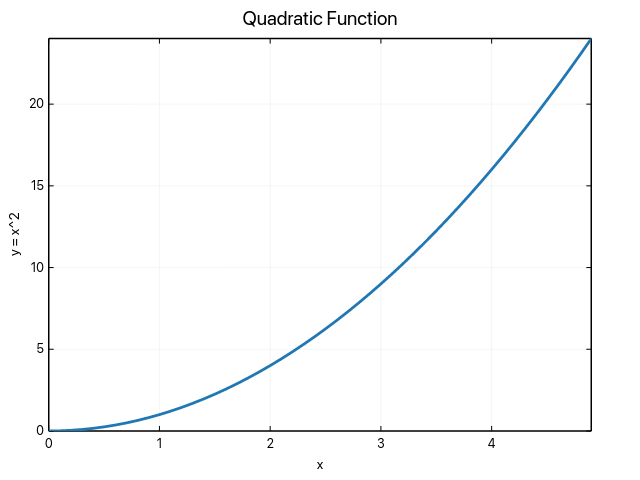
let quadratic: Vec<f64> = x.iter().map(|&v| v * v).collect();
Plot::new()
.line(&x, &linear)
.label("Linear")
.line(&x, &quadratic)
.label("Quadratic")
.legend(Position::TopLeft)
.theme(Theme::publication())
.save("series.png")?;
Ok(())
}
Top-level helpers are available for line, scatter, and bar plots:
use ruviz::prelude::*;

fn main() -> Result<()> {
    let x = vec![0.0, 1.0, 2.0];
    let y = vec![0.0, 1.0, 4.0];

    line(&x, &y)
        .title("Line")
        .save("line.png")?;

    Ok(())
}
The ruviz::simple module also provides file-oriented helper functions such as
line_plot, scatter_plot, bar_chart, and histogram.
Plot Types
The root Plot builder currently exposes:
- Basic: line, scatter, bar, histogram, box plot, heatmap
- Distribution: KDE, ECDF, violin, boxen
- Composition and polar: pie, donut styling, radar, polar line
- Continuous, discrete, and error plots: contour, area, step, stem, symmetric/asymmetric error bars
- Vector: quiver
- Layout helpers: subplots, legends, grid/tick controls, annotations, insets
Some lower-level modules contain additional experimental plot implementations
that do not yet have a high-level Plot::new().type(...) builder method.
Export
save("plot.png")writes PNG files on native targets.render()returns an in-memoryImage.render_png_bytes()returns PNG bytes.export_svg("plot.svg")writes SVG files on native targets.render_to_svg()returns an SVG string.save_pdf("plot.pdf")is available with thepdffeature.
For browser/wasm targets, use in-memory helpers such as render_png_bytes(),
render_to_svg(), and Image::encode_png() instead of native file-path export
helpers.
Feature Flags
Default features are ndarray and parallel.
| Feature | Description |
|---|---|
ndarray_support |
ndarray data support |
polars_support |
polars data support |
nalgebra_support |
nalgebra data support |
parallel |
enables the internal parallel renderer and backend metadata |
simd |
SIMD support used by performance-oriented paths |
performance |
shorthand for parallel + simd |
gpu |
enables GPU types and .gpu(true) metadata |
window |
desktop window dependencies |
interactive |
standalone interactive window support |
interactive-gpu |
interactive + gpu |
serde |
serialize themes/configuration types |
pdf |
PDF export via SVG-to-PDF |
typst-math |
Typst-backed text rendering |
animation |
GIF recording support |
full |
broad feature set for native builds |
SVG export is available without enabling the legacy svg feature.
Backend Notes
.backend(...), .auto_optimize(), and .get_backend_name() store or report
backend preference metadata. Use .resolved_backend_name() to inspect the
backend that the public PNG render/save path will use for the current plot.
Unsupported optimized backend preferences fall back to the Skia reference raster
path for output parity. auto_optimize() keeps public PNG output on the normal
visual path; supported large scatter workloads resolve to DataShader only when
that backend is explicitly configured.
Use release builds and benchmark your actual workload before adding optional performance features. See Backend Selection and Performance Optimization.
Typst Text Mode
Enable Typst-backed text rendering with:
[dependencies]
ruviz = { version = "0.4.19", features = ["typst-math"] }
Then call .typst(true):
use ruviz::prelude::*;

fn main() -> Result<()> {
    let x: Vec<f64> = (0..50).map(|i| i as f64 * 0.1).collect();
    let y: Vec<f64> = x.iter().map(|&v| (-v).exp()).collect();

    Plot::new()
        .line(&x, &y)
        .title("$f(x) = e^(-x)$")
        .xlabel("$x$")
        .ylabel("$f(x)$")
        .typst(true)
        .save("typst_plot.png")?;

    Ok(())
}
Without typst-math, .typst(true) and TextEngineMode::Typst are not
compiled. If Typst is optional in your crate, forward and guard your own feature:
[dependencies]
ruviz = { version = "0.4.19", default-features = false }

[features]
default = []
typst-math = ["ruviz/typst-math"]
use ruviz::prelude::*;

fn main() -> Result<()> {
    let x: Vec<f64> = (0..50).map(|i| i as f64 * 0.1).collect();
    let y: Vec<f64> = x.iter().map(|&v| (-v).exp()).collect();

    let mut plot = Plot::new()
        .line(&x, &y)
        .title("$f(x) = e^(-x)$");

    #[cfg(feature = "typst-math")]
    {
        plot = plot.typst(true);
    }

    plot.save("typst_plot.png")?;
    Ok(())
}
Examples
Rust documentation examples are in examples/doc_*.rs.
cargo run --example doc_line_plot
cargo run --example doc_scatter_plot
cargo run --example doc_typst_text --features typst-math
Interactive examples require the interactive feature:
cargo run --features interactive --example basic_interaction
cargo run --features interactive --example interactive_multi_series
Animation examples require the animation feature:
cargo run --features animation --example animation_basic
cargo run --features animation --example animation_wave
Documentation
Development
cargo test
cargo test --doc
cargo run --example basic_example --release
The workspace also contains companion crates and bindings, but this README focuses on the root Rust crate. See the subdirectory READMEs for those package surfaces.
License
Licensed under either of:
- Apache License, Version 2.0 (LICENSE or http://www.apache.org/licenses/LICENSE-2.0)
- MIT license (LICENSE or http://opensource.org/licenses/MIT)
at your option.
Dependencies
~19–43MB
~751K SLoC